Most Dangerous Cities in Oregon 2026 — Is Your City on the List?

Have you ever wondered which places to avoid in Oregon when the sun goes down? Crime can change fast, and the safest-looking street in the morning may feel uneasy at night. This guide breaks down the most dangerous cities in Oregon for 2026, shows the numbers behind the fear, and gives clear steps to stay safe.
- Which City in Oregon Has the Most Crime?
- Top 10 Most Dangerous Cities in Oregon (2026 Update)
- Table of Most Dangerous Cities in Oregon
- Crime Trends in Oregon’s Dangerous Cities (2026 Overview)
- How Reolink Determines the Most Dangerous City in Oregon?
- How to Stay Safe in Most Dangerous Cities and Neighborhoods in Oregon?
- FAQs
- Conclusion
Which City in Oregon Has the Most Crime?
Portland continues to report the highest raw volume of crime in the state due to its size, logging roughly 58,200 total offenses annually. However, the narrative around Portland's safety has split into two distinctly different real-world trends:
-
The Violent Crime Drop: Portland has experienced a historic, nation-leading decline in violent offenses. Homicides have plumetted by over 50% from their pandemic-era peaks down to a rate of roughly 8 per 100,000 residents, making Portland significantly safer in terms of violent crime than many similarly sized U.S. metros.
-
The Property Crime Reality: Conversely, property crime remains a severe challenge. Driven by high rates of vandalism, retail theft, and vehicle break-ins, Portland's property crime rate sits at 59.8 per 1,000 residents. Total vehicle theft rates remain high at 13.4 per 1,000 residents—nearly four times the national median. Overall, residents face a roughly 1-in-15 chance of experiencing a property-related offense.
Per-Capita Note: While Portland handles the largest sheer volume of police calls, smaller municipalities like Coos Bay and Ontario frequently surpass Portland on a strict per-capita basis, with Coos Bay recording a total crime rate of 64.8 per 1,000 residents heavily driven by regional drug trafficking corridors.
Top 10 Most Dangerous Cities in Oregon (2026 Update)
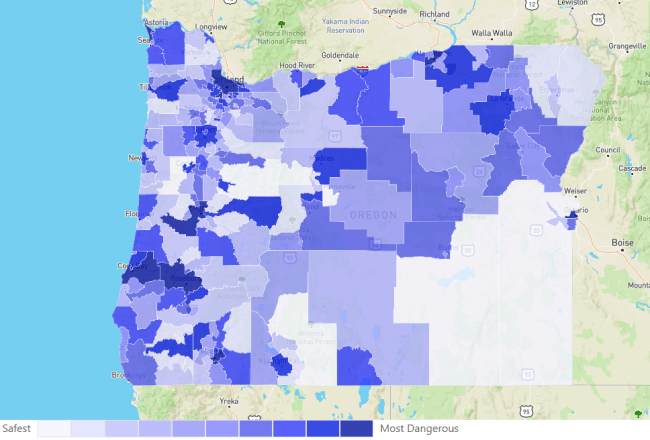
Oregon’s public safety risk profile covers vastly different geographic landscapes. While media headlines frequently center on the state's metropolitan core, an analysis of per-capita data shows that violent assaults, sophisticated theft rings, and chronic property crime stretch far outside Portland’s city limits. Rural highway corridors, major college hubs, and coastal ports all experience unique socioeconomic strains that drive up their crime metrics.
Here is the breakdown of the municipalities dealing with the highest per-capita and total crime numbers in the state.
1. Portland
-
Total Crime Rate: 66.9 per 1,000 residents
-
Violent Crime Rate: 7.2 per 1,000 residents
-
Property Crime Rate: 59.8 per 1,000 residents
-
Motor Vehicle Theft: 13.4 per 1,000 residents
While Portland has achieved a historic, nation-leading decline in homicides and gun violence over the last two years, property offenses remain a massive challenge. Vehicle theft rates hover at nearly four times the national median. Areas like Old Town/Chinatown, Downtown transit corridors, and the outer East Portland blocks (such as Hazelwood and Centennial) continue to account for the highest concentration of police calls.
2. Coos Bay
-
Total Crime Rate: 64.8 per 1,000 residents
-
Violent Crime Rate: 9.8 per 1,000 residents
-
Property Crime Rate: 55.1 per 1,000 residents
This coastal port carries Oregon’s highest per-capita violent crime rate—more than double the state average. Property crime is similarly severe, leaving residents with an elevated 1-in-18 chance of experiencing a theft or burglary. Law enforcement attributes these persistent numbers to regional drug trafficking corridors along U.S. Route 101, with hot spots concentrated around harbor parking lots and the Empire district.
3. Ontario
-
Total Crime Rate: 50.2 per 1,000 residents
-
Violent Crime Rate: 7.3 per 1,000 residents
-
Property Crime Rate: 43.0 per 1,000 residents
Ontario’s positioning directly on the Idaho border acts as a magnet for transient interstate traffic, skewing its crime rates relative to its permanent population size. Organized retail theft crews frequently target commercial plazas and motel lots radiating outward from Interstate 84, while local law enforcement notes consistent spikes in assault calls within the industrial sectors.
4. Roseburg
-
Total Crime Rate: 47.6 per 1,000 residents
-
Violent Crime Rate: 3.4 per 1,000 residents
-
Property Crime Rate: 44.2 per 1,000 residents
While Roseburg’s violent crime metrics remain relatively modest compared to coastal or metro hubs, its property crime numbers soar. Interstate timber freight traffic and heavily traveled commercial corridors make the Garden Valley and Harvard Avenue retail strips lucrative targets for opportunistic vehicle break-ins and retail shoplifting.
5. Medford
-
Total Crime Rate: 42.7 per 1,000 residents
-
Violent Crime Rate: 4.0 per 1,000 residents
-
Property Crime Rate: 38.7 per 1,000 residents
As the commercial capital of southern Oregon, Medford deals with systemic volume challenges. The Interstate 5 corridor funnels significant property crime into the city, keeping theft rates elevated. Property-related offenses, specifically catalytic converter thefts and commercial burglaries, heavily impact the North Medford commercial zones.
6. Grants Pass
-
Total Crime Rate: 40.4 per 1,000 residents
-
Violent Crime Rate: 4.4 per 1,000 residents
-
Property Crime Rate: 36.0 per 1,000 residents
Grants Pass features an elevated crime profile for a mid-sized municipality. Local public safety data frequently links property theft, minor assaults, and park-level disturbances to systemic unhoused population challenges along the Rogue River greenway, which are further exacerbated by dense weekend tourist crowds during peak seasons.=
7. Salem
-
Total Crime Rate: 37.0 per 1,000 residents
-
Violent Crime Rate: 4.6 per 1,000 residents
-
Property Crime Rate: 32.4 per 1,000 residents
The state capital battles a persistent auto theft ring problem, logging a vehicle theft rate of 5.1 per 1,000 residents. Opportunistic thieves frequently target high-volume commuter parking garages downtown before melting away into the sprawling residential complexes on the south side of the city.
8. Eugene
-
Total Crime Rate: 35.7 per 1,000 residents
-
Violent Crime Rate: 3.6 per 1,000 residents
-
Property Crime Rate: 32.2 per 1,000 residents
A sprawling university population combined with heavy trans-state traffic keeps Eugene's property crime rates high. Bike-path robberies, opportunistic student housing break-ins, and vehicle smash-and-grabs see predictable, sharp escalations during autumn football weekends and major campus events.
9. Klamath Falls
-
Total Crime Rate: 25.8 per 1,000 residents
-
Violent Crime Rate: 5.2 per 1,000 residents
-
Property Crime Rate: 20.6 per 1,000 residents
Klamath Falls displays an inverse trend to the rest of the state: its property crime is relatively low, but its violent crime rate is the third-highest in Oregon. Because the city relies on isolated highways and rural infrastructure, local law enforcement response times can be significantly delayed, particularly during late-night hours in peripheral neighborhoods.
10. Springfield
-
Total Crime Rate: 30.9 per 1,000 residents
-
Violent Crime Rate: 3.2 per 1,000 residents
-
Property Crime Rate: 27.6 per 1,000 residents
Directly bordering its larger neighbor, Eugene, Springfield rounds out the list. The bulk of local offenses are concentrated heavily within the high-traffic Gateway Mall retail area and older, industrial mill neighborhoods, where property theft and vehicle break-ins dominate police blotters.
Reference Links:
-
SafeWise State of Safety Study: Oregon's Safest Cities of 2026 & Property Crime Trends
-
Major Cities Chiefs Association (MCCA): 2025-2026 Violent Crime Survey & Metropolitan Progress Reports
Table of Most Dangerous Cities in Oregon
Crime Trends in Oregon’s Dangerous Cities (2026 Overview)
Across Oregon’s most crime-affected cities—led by Portland, Coos Bay, Ontario, and Medford—recent FBI-based and local police reporting highlights several consistent statewide patterns shaping both violent and property crime levels.
-
Motor vehicle theft remains a key driver, but shows uneven improvement: Cities like Portland (13.4 per 1,000) and Salem (5.1 per 1,000) still record some of the highest auto theft rates in the state, though statewide enforcement efforts and layered deterrents have contributed to stabilization or modest declines in some urban corridors.
-
Property crime dominates overall risk profiles: In nearly every high-ranking city—including Portland (59.8 per 1,000), Coos Bay (55.1), and Roseburg (44.2)—property offenses far exceed violent crime, driven by retail theft, vehicle break-ins, and residential burglaries.
-
Retail and “grab-and-go” theft patterns concentrate in commercial hubs: Portland, Eugene, and Springfield continue to see frequent coordinated retail theft activity, especially in high-traffic shopping districts and areas near transit corridors, contributing significantly to elevated property crime rates.
-
Regional drug markets correlate with higher violent crime pockets: Cities such as Coos Bay (9.8 per 1,000 violent crime rate) and Klamath Falls (5.2 per 1,000) show stronger associations between drug trafficking corridors and assaults, particularly in port zones, highway-adjacent neighborhoods, and transient-heavy districts.
-
Crime is highly localized within city “hot spots” rather than evenly distributed: In Portland, for example, higher concentrations of incidents cluster in Downtown, Old Town/Chinatown, and parts of East Portland, while similar neighborhood-level clustering appears in Medford’s commercial corridors and Ontario’s interstate-adjacent retail zones. Cities (2026 Overview)
How Reolink Determines the Most Dangerous City in Oregon?
To fairly compare safety across Oregon cities, Reolink uses a consistent, data-driven approach based on publicly available crime statistics. Because crime risk varies significantly between large metro areas and smaller towns, we evaluate both total volume and per-capita exposure to provide a more accurate picture of real-world safety.
- FBI-reported violent crime rate (per 1,000 residents): This includes murder, rape, robbery, and aggravated assault. Higher rates indicate greater personal safety risk.
- FBI-reported property crime rate (per 1,000 residents): This covers burglary, larceny/theft, arson, and other non-violent offenses that directly affect households and businesses.
- Motor vehicle theft rate: Car theft is tracked separately due to its strong correlation with organized theft activity and repeat-target hotspots, especially in larger cities like Portland and Salem.
- Trend direction over time: Cities that show sustained increases over multiple years are weighted more heavily than those with stable or declining crime rates, even if current levels are similar.
- Population-adjusted impact (per-capita vs. total crime): Large cities may lead in total incidents, while smaller cities may rank higher in per-capita risk. Reolink evaluates both to avoid skewed comparisons and to reflect actual resident exposure.
Bottom line: This methodology ensures that Oregon’s “most dangerous cities” ranking reflects not just raw crime totals, but also true individual risk, crime concentration, and ongoing trends across each community.
How to Stay Safe in Most Dangerous Cities and Neighborhoods in Oregon?
Whether you’re living in or passing through higher-crime areas like Portland, Coos Bay, or Medford, small daily habits can significantly reduce your risk. Based on real-world patterns seen in Oregon’s urban and transit-heavy neighborhoods, here are practical safety steps you can follow.
Lock Up Twice (Layered Vehicle Security)
Car theft remains one of Oregon’s most common property crimes—especially in Portland (13.4 per 1,000 residents) and Salem. In real situations reported by local residents, quick “smash-and-grab” thefts often target unlocked or lightly secured vehicles. Using both a steering wheel lock and your built-in alarm adds a visible barrier that discourages opportunistic thieves.
Park Under Light and Visibility
Well-lit parking areas significantly reduce break-in risk. In cities like Eugene and Springfield, vehicle theft and break-ins are more common in dim apartment lots, trailheads, and underused transit parking structures. Choosing spots near streetlights, entrances, or active foot traffic makes your vehicle less attractive to offenders.
Watch Bags in Downtown and Transit Zones
In downtown Portland, Old Town/Chinatown, and Medford commercial corridors, petty theft often occurs in crowded pedestrian zones. Keep bags zipped and held in front of you, especially near bars, transit stops, and event areas where distraction-based theft is more likely than direct confrontation.
Save Your Local Non-Emergency Number
In Oregon cities like Grants Pass and Salem, residents often use non-emergency police lines to report suspicious activity without calling 911. Saving this number helps you quickly report issues like loitering, vandalism, or unusual activity in parking areas or neighborhoods.
Check Local Crime Maps Before You Go
Cities such as Portland and Eugene publish neighborhood-level crime maps showing recent incidents. Locals frequently review these before choosing hotels, rentals, or parking locations, especially in higher-activity districts near downtown cores and major highways.
Use Security Cameras for Home and Vehicle Protection
In higher-crime cities like Portland, Medford, and Coos Bay, property crimes such as vehicle theft and porch theft often happen quickly and without confrontation. Installing outdoor security cameras helps deter opportunistic offenders and provides clear footage if an incident occurs. Many residents place cameras covering driveways, front doors, and garage areas to monitor activity in real time and receive instant alerts.
For added protection, Oregon homeowners can consider the new Reolink OMVi PoE to monitor driveways, garages, and entry points—especially in areas with higher vehicle theft and property crime rates.
All-in-one Triple-Lens 180° Panoramic Pan-Tilt Security Camera
10MP Dual-Lens 180° View, 4K 360° Full Coverage, SyncTrack with auto framing & auto tracking, Local Storage (No Monthly Fees), Local AI Video Search.
FAQs
What is the least safest city in Oregon?
Based on recent FBI-style city comparisons, Portland is often considered the least safe in total crime volume, with the highest overall number of reported incidents in the state (driven by its large population and high property crime rate of ~59.8 per 1,000 residents).
However, when looking at per-capita risk, smaller cities such as Coos Bay (9.8 violent crimes per 1,000 residents) and Ontario can rank higher in specific categories like violent crime or theft rates.
What is the #1 most violent city in the US?
There is no single permanent “#1 most violent city” because rankings change year to year and depend on data source (FBI vs. local reporting) and population size.
However, cities that have frequently ranked among the highest violent crime rates in recent FBI-based reports include places like:
- St. Louis, Missouri
- Baltimore, Maryland
- Memphis, Tennessee
These cities typically have high violent crime rates per 100,000 residents, but rankings shift annually as crime trends change.
What is the most burglarized city in Oregon?
Based on recent Oregon city crime data, Portland generally reports the highest total number of burglaries and property crimes in the state, due to its population size and dense urban areas. In terms of burglary risk relative to population, smaller cities such as Coos Bay and Roseburg also show elevated property crime rates
Conclusion
Oregon’s scenic highways cross pockets of real danger. Portland, Coos Bay, Ontario, Medford, and Grants Pass lead the pack of the most dangerous cities in Oregon, while smaller hubs like Roseburg and Springfield also demand caution.
Stay alert, follow the safety tips above, and share your thoughts below. Did your hometown make our list? Let us know and help others avoid the next headline.
Search
Subscribe for the Latest Updates
Security insights & offers right into your inbox